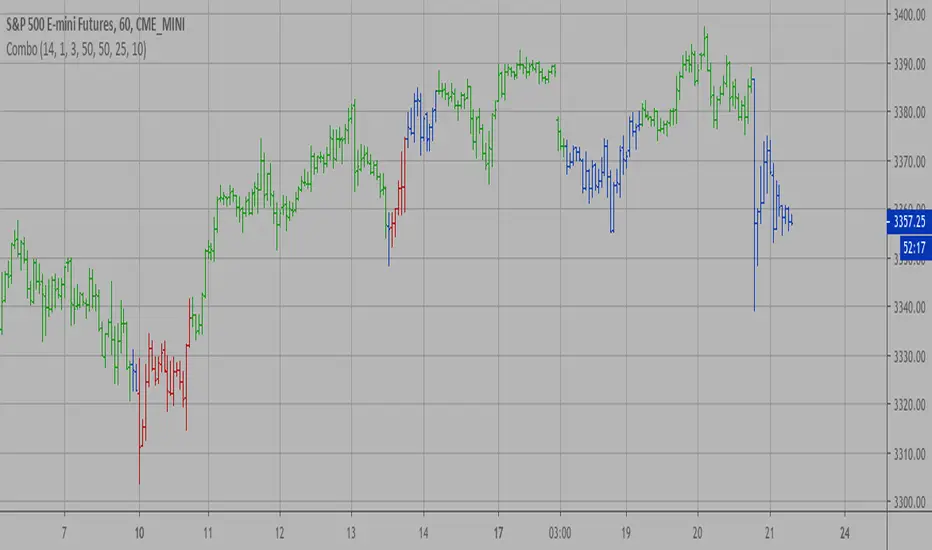
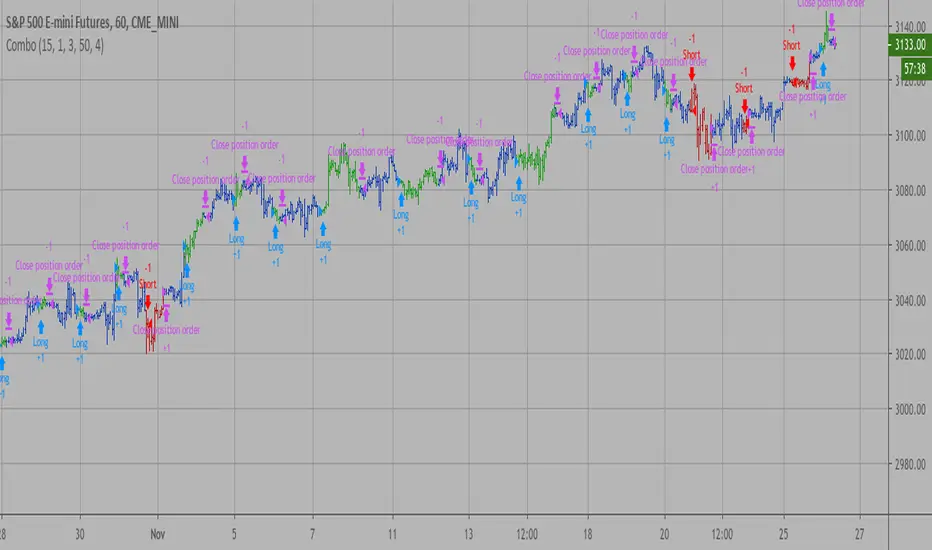
Combo Strategy 123 Reversal & CMOaDisparity Index This is combo strategies for get a cumulative signal.
First strategy
This System was created from the Book "How I Tripled My Money In The
Futures Market" by Ulf Jensen, Page 183. This is reverse type of strategies.
The strategy buys at market, if close price is higher than the previous close
during 2 days and the meaning of 9-days Stochastic Slow Oscillator is lower than 50.
The strategy sells at market, if close price is lower than the previous close price
during 2 days and the meaning of 9-days Stochastic Fast Oscillator is higher than 50.
Second strategy
The related CMO Disparity Index article is copyrighted material from Stocks & Commodities Dec 2009
My strategy modification.
WARNING:
- For purpose educate only
- This script to change bars colors.
Search in scripts for "the strat"
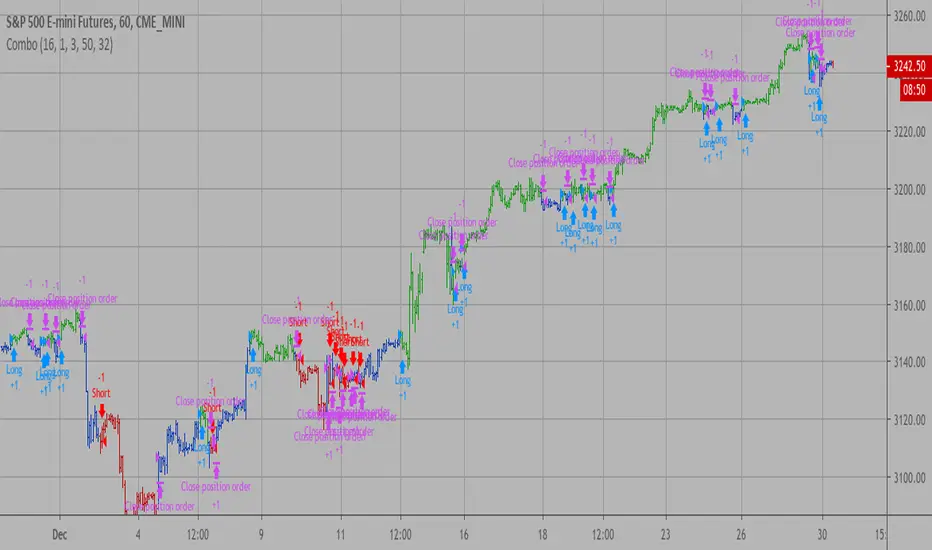
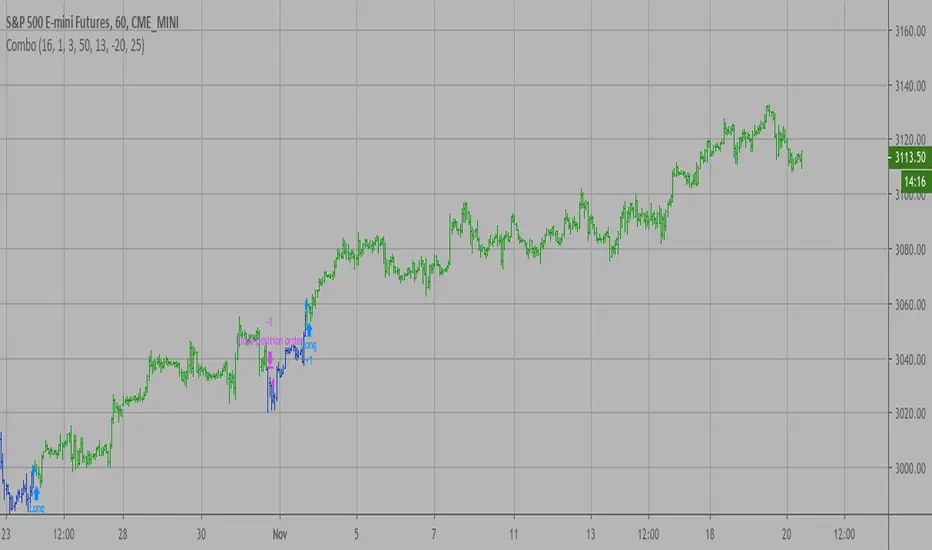
Combo Backtest 123 Reversal & Directional Trend Index (DTI) This is combo strategies for get a cumulative signal.
First strategy
This System was created from the Book "How I Tripled My Money In The
Futures Market" by Ulf Jensen, Page 183. This is reverse type of strategies.
The strategy buys at market, if close price is higher than the previous close
during 2 days and the meaning of 9-days Stochastic Slow Oscillator is lower than 50.
The strategy sells at market, if close price is lower than the previous close price
during 2 days and the meaning of 9-days Stochastic Fast Oscillator is higher than 50.
Second strategy
This technique was described by William Blau in his book "Momentum,
Direction and Divergence" (1995). His book focuses on three key aspects
of trading: momentum, direction and divergence. Blau, who was an electrical
engineer before becoming a trader, thoroughly examines the relationship between
price and momentum in step-by-step examples. From this grounding, he then looks
at the deficiencies in other oscillators and introduces some innovative techniques,
including a fresh twist on Stochastics. On directional issues, he analyzes the
intricacies of ADX and offers a unique approach to help define trending and
non-trending periods.
Directional Trend Index is an indicator similar to DM+ developed by Welles Wilder.
The DM+ (a part of Directional Movement System which includes both DM+ and
DM- indicators) indicator helps determine if a security is "trending." William
Blau added to it a zeroline, relative to which the indicator is deemed positive or
negative. A stable uptrend is a period when the DTI value is positive and rising, a
downtrend when it is negative and falling.
WARNING:
- For purpose educate only
- This script to change bars colors.

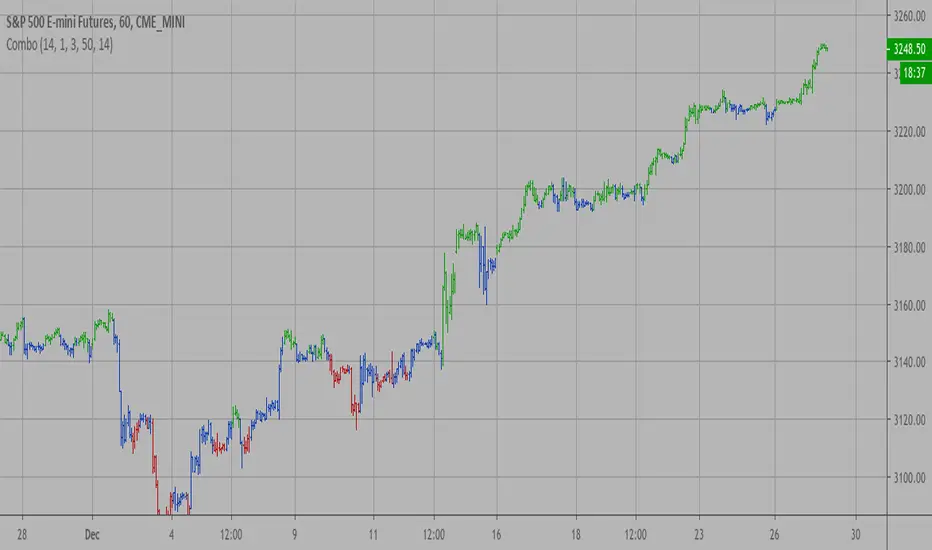
Combo Strategy 123 Reversal & Directional Trend Index (DTI) This is combo strategies for get a cumulative signal.
First strategy
This System was created from the Book "How I Tripled My Money In The
Futures Market" by Ulf Jensen, Page 183. This is reverse type of strategies.
The strategy buys at market, if close price is higher than the previous close
during 2 days and the meaning of 9-days Stochastic Slow Oscillator is lower than 50.
The strategy sells at market, if close price is lower than the previous close price
during 2 days and the meaning of 9-days Stochastic Fast Oscillator is higher than 50.
Second strategy
This technique was described by William Blau in his book "Momentum,
Direction and Divergence" (1995). His book focuses on three key aspects
of trading: momentum, direction and divergence. Blau, who was an electrical
engineer before becoming a trader, thoroughly examines the relationship between
price and momentum in step-by-step examples. From this grounding, he then looks
at the deficiencies in other oscillators and introduces some innovative techniques,
including a fresh twist on Stochastics. On directional issues, he analyzes the
intricacies of ADX and offers a unique approach to help define trending and
non-trending periods.
Directional Trend Index is an indicator similar to DM+ developed by Welles Wilder.
The DM+ (a part of Directional Movement System which includes both DM+ and
DM- indicators) indicator helps determine if a security is "trending." William
Blau added to it a zeroline, relative to which the indicator is deemed positive or
negative. A stable uptrend is a period when the DTI value is positive and rising, a
downtrend when it is negative and falling.
WARNING:
- For purpose educate only
- This script to change bars colors.

Combo Backtest 123 Reversal & DiNapoli Detrended Oscillator This is combo strategies for get a cumulative signal.
First strategy
This System was created from the Book "How I Tripled My Money In The
Futures Market" by Ulf Jensen, Page 183. This is reverse type of strategies.
The strategy buys at market, if close price is higher than the previous close
during 2 days and the meaning of 9-days Stochastic Slow Oscillator is lower than 50.
The strategy sells at market, if close price is lower than the previous close price
during 2 days and the meaning of 9-days Stochastic Fast Oscillator is higher than 50.
Second strategy
DiNapoli Detrended Oscillator Strategy
WARNING:
- For purpose educate only
- This script to change bars colors.

Combo Strategy 123 Reversal & DiNapoli Detrended Oscillator This is combo strategies for get a cumulative signal.
First strategy
This System was created from the Book "How I Tripled My Money In The
Futures Market" by Ulf Jensen, Page 183. This is reverse type of strategies.
The strategy buys at market, if close price is higher than the previous close
during 2 days and the meaning of 9-days Stochastic Slow Oscillator is lower than 50.
The strategy sells at market, if close price is lower than the previous close price
during 2 days and the meaning of 9-days Stochastic Fast Oscillator is higher than 50.
Second strategy
DiNapoli Detrended Oscillator Strategy
WARNING:
- For purpose educate only
- This script to change bars colors.

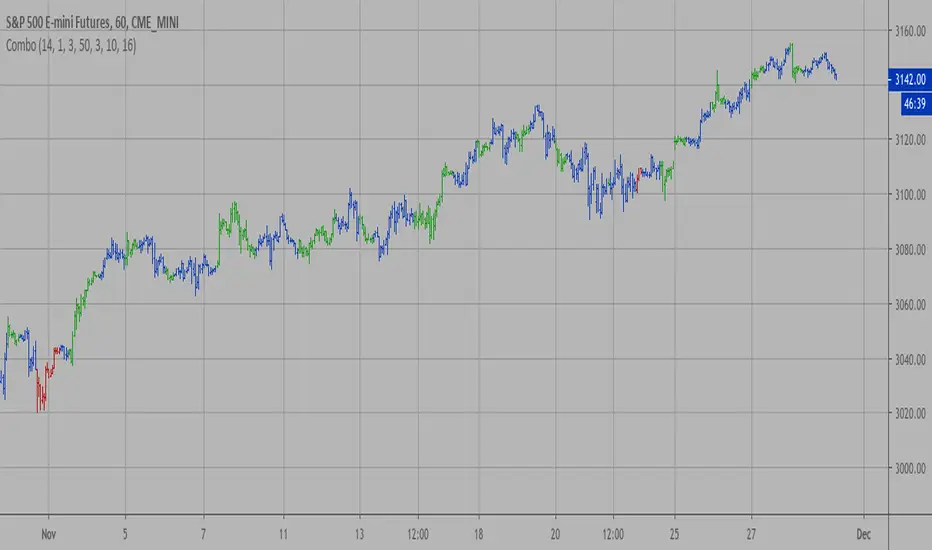
Combo Backtest 123 Detrended Price Oscillator This is combo strategies for get a cumulative signal.
First strategy
This System was created from the Book "How I Tripled My Money In The
Futures Market" by Ulf Jensen, Page 183. This is reverse type of strategies.
The strategy buys at market, if close price is higher than the previous close
during 2 days and the meaning of 9-days Stochastic Slow Oscillator is lower than 50.
The strategy sells at market, if close price is lower than the previous close price
during 2 days and the meaning of 9-days Stochastic Fast Oscillator is higher than 50.
Second strategy
The Detrend Price Osc indicator is similar to a moving average,
in that it filters out trends in prices to more easily identify
cycles. The indicator is an attempt to define cycles in a trend
by drawing a moving average as a horizontal straight line and
placing prices along the line according to their relation to a
moving average. It provides a means of identifying underlying
cycles not apparent when the moving average is viewed within a
price chart. Cycles of a longer duration than the Length (number
of bars used to calculate the Detrend Price Osc) are effectively
filtered or removed by the oscillator.
WARNING:
- For purpose educate only
- This script to change bars colors.
Combo Strategy 123 Detrended Price Oscillator This is combo strategies for get a cumulative signal.
First strategy
This System was created from the Book "How I Tripled My Money In The
Futures Market" by Ulf Jensen, Page 183. This is reverse type of strategies.
The strategy buys at market, if close price is higher than the previous close
during 2 days and the meaning of 9-days Stochastic Slow Oscillator is lower than 50.
The strategy sells at market, if close price is lower than the previous close price
during 2 days and the meaning of 9-days Stochastic Fast Oscillator is higher than 50.
Second strategy
The Detrend Price Osc indicator is similar to a moving average,
in that it filters out trends in prices to more easily identify
cycles. The indicator is an attempt to define cycles in a trend
by drawing a moving average as a horizontal straight line and
placing prices along the line according to their relation to a
moving average. It provides a means of identifying underlying
cycles not apparent when the moving average is viewed within a
price chart. Cycles of a longer duration than the Length (number
of bars used to calculate the Detrend Price Osc) are effectively
filtered or removed by the oscillator.
WARNING:
- For purpose educate only
- This script to change bars colors.
Leverage Strategy and a few words on risk/opportunityHello traders,
I started this script as a joke for someone... finally appears it could be used for educational content
Let's talk about leverage and margin call
Margin Call
A margin call is the broker's demand that an investor deposit additional money or securities so that the account is brought up to the minimum value, known as the maintenance margin.
A margin call usually means that one or more of the securities held in the margin account has decreased in value below a certain point.
Leverage
A leverage is a system which allows the trader to open positions much larger than his own capital. ... “Leverage” usually refers to the ratio between the position value and the investment needed,
Strat
The strategy simulates long/short positions on a 4h high/low breakout based on the chart candle close.
The panel below shows the strategy equity curve. Activating the margin call option will show when the account would be margin called giving the settings
Casino
I'm not doing any financial recommendation here.
I made this strategy so that people include more risk management metrics into their strategy.
From the code, we see it's fairly easy to calculate a leveraged position size and a margin call flag - when that flag is hit, the system stops trading.
I simplified things to the extreme here but my point is that the leverage is a double-edge sword gift.
Assuming we always take the same position sizing, increasing the leverage speed up how fast a margin could be ..... called. (bad joke? feel free to tell me). Not saying it will, saying it introduces more risk by design.
Then one could say "I'll just turn off that stupid margin call option". And that's when someone starts backtesting with unrealistic market conditions.
Finally...
When I backtest I always assume the worst in every scenario possible (because I'm French), I always try to minimize the risk first (also because I'm French), keeping as close from 0 as possible (French again)
Then I add the "opportunity" component, looking to catch the maximum of opportunity while keeping the risk low.
It's like a Rubix cube puzzle - decreasing the risk is one side of the equation but whenever I try to catch more opportunity... my risks increases.
Then I update my risk... and now the opportunity decreases... (#wut #wen #simple)
Completely removing the risk from a trading strategy isn't something I wouldn't dare doing.
Trading involves risk. Being obsessed by decreasing the risk is what I do BEST :)
Dave

Combo Backtest 123 Reversal & DAPD This is combo strategies for get a cumulative signal.
First strategy
This System was created from the Book "How I Tripled My Money In The
Futures Market" by Ulf Jensen, Page 183. This is reverse type of strategies.
The strategy buys at market, if close price is higher than the previous close
during 2 days and the meaning of 9-days Stochastic Slow Oscillator is lower than 50.
The strategy sells at market, if close price is lower than the previous close price
during 2 days and the meaning of 9-days Stochastic Fast Oscillator is higher than 50.
Second strategy
This indicator is similar to Bollinger Bands. It based on DAPD - Daily
Average Price Delta. DAPD is based upon a summation for each of the
highs (hod) for the 21 days prior to today minus the summation for
each of the lows (lod) for the last 21 days prior to today. The result
of this calculation would then be divided by 21.
It will be buy when high above previos DAPD high and sell if low below previos DAPD low
WARNING:
- For purpose educate only
- This script to change bars colors.

Combo Strategy 123 Reversal & DAPD This is combo strategies for get a cumulative signal.
First strategy
This System was created from the Book "How I Tripled My Money In The
Futures Market" by Ulf Jensen, Page 183. This is reverse type of strategies.
The strategy buys at market, if close price is higher than the previous close
during 2 days and the meaning of 9-days Stochastic Slow Oscillator is lower than 50.
The strategy sells at market, if close price is lower than the previous close price
during 2 days and the meaning of 9-days Stochastic Fast Oscillator is higher than 50.
Second strategy
This indicator is similar to Bollinger Bands. It based on DAPD - Daily
Average Price Delta. DAPD is based upon a summation for each of the
highs (hod) for the 21 days prior to today minus the summation for
each of the lows (lod) for the last 21 days prior to today. The result
of this calculation would then be divided by 21.
It will be buy when high above previos DAPD high and sell if low below previos DAPD low
WARNING:
- For purpose educate only
- This script to change bars colors.

Combo Backtest 123 Reversal & D_Three Ten OscThis is combo strategies for get a cumulative signal.
First strategy
This System was created from the Book "How I Tripled My Money In The
Futures Market" by Ulf Jensen, Page 183. This is reverse type of strategies.
The strategy buys at market, if close price is higher than the previous close
during 2 days and the meaning of 9-days Stochastic Slow Oscillator is lower than 50.
The strategy sells at market, if close price is lower than the previous close price
during 2 days and the meaning of 9-days Stochastic Fast Oscillator is higher than 50.
Second strategy
TradeStation does not allow the user to make a Multi Data Chart with
a Tick Bar Chart and any other type a chart. This indicator allows the
user to plot a daily 3-10 Oscillator on a Tick Bar Chart or any intraday interval.
Walter Bressert's 3-10 Oscillator is a detrending oscillator derived
from subtracting a 10 day moving average from a 3 day moving average.
The second plot is an 16 day simple moving average of the 3-10 Oscillator.
The 16 period moving average is the slow line and the 3/10 oscillator is
the fast line.
For more information on the 3-10 Oscillator see Walter Bressert's book
"The Power of Oscillator/Cycle Combinations"
WARNING:
- For purpose educate only
- This script to change bars colors.

Combo Backtest 123 Reversal & D_Three Ten Osc This is combo strategies for get a cumulative signal.
First strategy
This System was created from the Book "How I Tripled My Money In The
Futures Market" by Ulf Jensen, Page 183. This is reverse type of strategies.
The strategy buys at market, if close price is higher than the previous close
during 2 days and the meaning of 9-days Stochastic Slow Oscillator is lower than 50.
The strategy sells at market, if close price is lower than the previous close price
during 2 days and the meaning of 9-days Stochastic Fast Oscillator is higher than 50.
Second strategy
TradeStation does not allow the user to make a Multi Data Chart with
a Tick Bar Chart and any other type a chart. This indicator allows the
user to plot a daily 3-10 Oscillator on a Tick Bar Chart or any intraday interval.
Walter Bressert's 3-10 Oscillator is a detrending oscillator derived
from subtracting a 10 day moving average from a 3 day moving average.
The second plot is an 16 day simple moving average of the 3-10 Oscillator.
The 16 period moving average is the slow line and the 3/10 oscillator is
the fast line.
For more information on the 3-10 Oscillator see Walter Bressert's book
"The Power of Oscillator/Cycle Combinations"
WARNING:
- For purpose educate only
- This script to change bars colors.
Combo Backtest 123 Reversal & D_ELI (Ehlers Leading Indicator) This is combo strategies for get a cumulative signal.
First strategy
This System was created from the Book "How I Tripled My Money In The
Futures Market" by Ulf Jensen, Page 183. This is reverse type of strategies.
The strategy buys at market, if close price is higher than the previous close
during 2 days and the meaning of 9-days Stochastic Slow Oscillator is lower than 50.
The strategy sells at market, if close price is lower than the previous close price
during 2 days and the meaning of 9-days Stochastic Fast Oscillator is higher than 50.
Second strategy
This Indicator plots a single
Daily DSP (Detrended Synthetic Price) and a Daily ELI (Ehlers Leading
Indicator) using intraday data.
Detrended Synthetic Price is a function that is in phase with the dominant
cycle of real price data. This one is computed by subtracting a 3 pole Butterworth
filter from a 2 Pole Butterworth filter. Ehlers Leading Indicator gives an advanced
indication of a cyclic turning point. It is computed by subtracting the simple
moving average of the detrended synthetic price from the detrended synthetic price.
Buy and Sell signals arise when the ELI indicator crosses over or under the detrended
synthetic price.
See "MESA and Trading Market Cycles" by John Ehlers pages 64 - 70.
WARNING:
- For purpose educate only
- This script to change bars colors.

Combo Backtest 123 Reversal & Detrended Synthetic Price V 2 This is combo strategies for get a cumulative signal.
First strategy
This System was created from the Book "How I Tripled My Money In The
Futures Market" by Ulf Jensen, Page 183. This is reverse type of strategies.
The strategy buys at market, if close price is higher than the previous close
during 2 days and the meaning of 9-days Stochastic Slow Oscillator is lower than 50.
The strategy sells at market, if close price is lower than the previous close price
during 2 days and the meaning of 9-days Stochastic Fast Oscillator is higher than 50.
Second strategy
Detrended Synthetic Price is a function that is in phase with the
dominant cycle of real price data. This DSP is computed by subtracting
a half-cycle exponential moving average (EMA) from the quarter cycle
exponential moving average.
See "MESA and Trading Market Cycles" by John Ehlers pages 64 - 70.
WARNING:
- For purpose educate only
- This script to change bars colors.
Combo Backtest 123 Reversal & D_DSP (Detrended Synthetic Price) This is combo strategies for get a cumulative signal.
First strategy
This System was created from the Book "How I Tripled My Money In The
Futures Market" by Ulf Jensen, Page 183. This is reverse type of strategies.
The strategy buys at market, if close price is higher than the previous close
during 2 days and the meaning of 9-days Stochastic Slow Oscillator is lower than 50.
The strategy sells at market, if close price is lower than the previous close price
during 2 days and the meaning of 9-days Stochastic Fast Oscillator is higher than 50.
Second strategy
Detrended Synthetic Price is a function that is in phase with the
dominant cycle of real price data. This DSP is computed by subtracting
a half-cycle exponential moving average (EMA) from the quarter cycle
exponential moving average.
See "MESA and Trading Market Cycles" by John Ehlers pages 64 - 70.
WARNING:
- For purpose educate only
- This script to change bars colors.

Combo Backtest 123 Reversal & Cueing Off Sup/Res Levels This is combo strategies for get a cumulative signal.
First strategy
This System was created from the Book "How I Tripled My Money In The
Futures Market" by Ulf Jensen, Page 183. This is reverse type of strategies.
The strategy buys at market, if close price is higher than the previous close
during 2 days and the meaning of 9-days Stochastic Slow Oscillator is lower than 50.
The strategy sells at market, if close price is lower than the previous close price
during 2 days and the meaning of 9-days Stochastic Fast Oscillator is higher than 50.
Second strategy
Cueing Off Support And Resistance Levels, by Thom Hartle
modified by HPotter for trade signals.
The related article is copyrighted material from Stocks & Commodities.
WARNING:
- For purpose educate only
- This script to change bars colors.

Combo Strategy 123 Reversal & Cueing Off Sup/Res Levels This is combo strategies for get a cumulative signal.
First strategy
This System was created from the Book "How I Tripled My Money In The
Futures Market" by Ulf Jensen, Page 183. This is reverse type of strategies.
The strategy buys at market, if close price is higher than the previous close
during 2 days and the meaning of 9-days Stochastic Slow Oscillator is lower than 50.
The strategy sells at market, if close price is lower than the previous close price
during 2 days and the meaning of 9-days Stochastic Fast Oscillator is higher than 50.
Second strategy
Cueing Off Support And Resistance Levels, by Thom Hartle
modified by HPotter for trade signals.
The related article is copyrighted material from Stocks & Commodities.
WARNING:
- For purpose educate only
- This script to change bars colors.
Combo Backtest 123 Reversal & Confluence This is combo strategies for get a cumulative signal.
First strategy
This System was created from the Book "How I Tripled My Money In The
Futures Market" by Ulf Jensen, Page 183. This is reverse type of strategies.
The strategy buys at market, if close price is higher than the previous close
during 2 days and the meaning of 9-days Stochastic Slow Oscillator is lower than 50.
The strategy sells at market, if close price is lower than the previous close price
during 2 days and the meaning of 9-days Stochastic Fast Oscillator is higher than 50.
Second strategy
This is modified version of Dale Legan's "Confluence" indicator written by Gary Fritz.
================================================================
Here is Gary`s commentary:
Since the Confluence indicator returned several "states" (bull, bear, grey, and zero),
he modified the return value a bit:
-9 to -1 = Bearish
-0.9 to 0.9 = "grey" (and zero)
1 to 9 = Bullish
The "grey" range corresponds to the "grey" values plotted by Dale's indicator, but
they're divided by 10.
WARNING:
- For purpose educate only
- This script to change bars colors.

TradersAI_UTBotCREDITS to @HPotter for the orginal code.
CREDITS to @Yo_adriiiiaan for recently publishing the UT Bot study based on the original code -
I just added some simple code to turn it into a strategy. Now, anyone can simply add the strategy to their chart to see the backtesting results!
While @Yo_adriiiiaan mentions it works best on a 4-hour timeframe or above, I am happy to share that this seems to be working on a 15-minute chart on e-mini S&P 500 Index (using the KeyValue setting at 10)! You can play around with the different settings, and may be you might discover even better settings.
Hope this helps. Btw, if any of you play with different settings and discover great settings for a specific instrument, please share them with the community here - it will be rewarded back multiple times!

Combo Strategy 123 Reversal & Confluence This is combo strategies for get a cumulative signal.
First strategy
This System was created from the Book "How I Tripled My Money In The
Futures Market" by Ulf Jensen, Page 183. This is reverse type of strategies.
The strategy buys at market, if close price is higher than the previous close
during 2 days and the meaning of 9-days Stochastic Slow Oscillator is lower than 50.
The strategy sells at market, if close price is lower than the previous close price
during 2 days and the meaning of 9-days Stochastic Fast Oscillator is higher than 50.
Second strategy
This is modified version of Dale Legan's "Confluence" indicator written by Gary Fritz.
================================================================
Here is Gary`s commentary:
Since the Confluence indicator returned several "states" (bull, bear, grey, and zero),
he modified the return value a bit:
-9 to -1 = Bearish
-0.9 to 0.9 = "grey" (and zero)
1 to 9 = Bullish
The "grey" range corresponds to the "grey" values plotted by Dale's indicator, but
they're divided by 10.
WARNING:
- For purpose educate only
- This script to change bars colors.
Combo Backtest 123 Reversal & Comparative Relative Strength This is combo strategies for get a cumulative signal.
First strategy
This System was created from the Book "How I Tripled My Money In The
Futures Market" by Ulf Jensen, Page 183. This is reverse type of strategies.
The strategy buys at market, if close price is higher than the previous close
during 2 days and the meaning of 9-days Stochastic Slow Oscillator is lower than 50.
The strategy sells at market, if close price is lower than the previous close price
during 2 days and the meaning of 9-days Stochastic Fast Oscillator is higher than 50.
Second strategy
Comparative Relative Strength Strategy for ES
WARNING:
- For purpose educate only
- This script to change bars colors.
